
Operational Insights For Retail
We transform in-store activity into standardised, management-ready KPIs and tailored reports—so leadership teams can compare performance, spot gaps, and act with confidence.
No dashboards to manage. No data overload.
Just insights your management team actually uses.
Why Most Analytics Never Reach The Boardroom
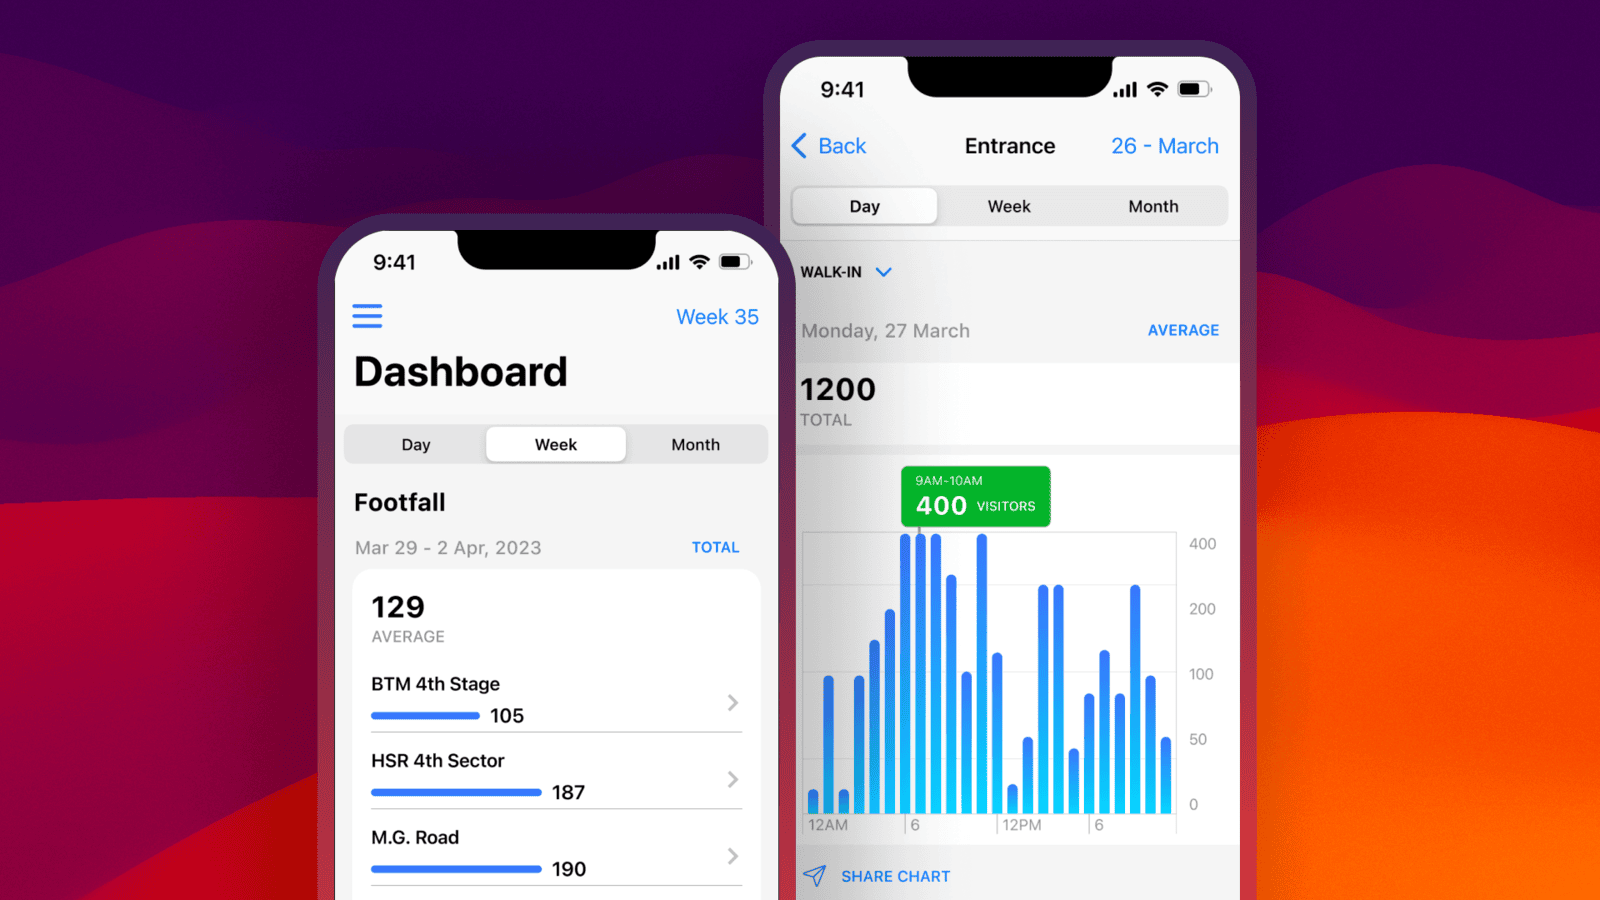
Most analytics solutions stop at dashboards.
They generate data, charts, and alerts—but leave interpretation, alignment, and action to already busy teams.
They generate data, charts, and alerts—but leave interpretation, alignment, and action to already busy teams.
For leadership, this creates familiar problems :
- Different KPIs across regions
- Inconsistent definitions and performance
- Data that looks impressive but isn't discussed
- No single trusted view across all locations
When every team speaks different metric language, decision making slows down
We Lead With Insights. Not Tools
We deliver Insights As A Service - a business model designed around how management teams actually operate
Instead of asking leaders to log into dashboards, we provide :
Standardised KPIs
- Standardised KPIs across all locations
- Custom KPIs tailored to your operating model
- Periodic management ready reports (Weekly, Monthly, Quarterly)
How it helps Ops & CXOs
- Easy store-to-store and region-to-region comparison
- Faster identification of underperforming locations
- Clear linkage between traffic, conversion, and outcomes
While dashboards require time, interpretation and alignment, our reports are designed to be read, discussed and acted upon
While dashboards require time, interpretation, and alignment, our reports are designed to be read, discussed, and acted upon.
KPIs Built For Decision Makers
A common language of performance across the organisation.
Standard KPIs
- Footfall trends & growth Indices
- Store and region performance benchmarks
- Dwell & Engagement Indicators
- Peak Hour & Staffing Alignment
- Composite performance scores for easy comparison
Custom KPIs (built around your business)
- Zone level performance
- Campaign impact metrics
- Layout and merchandising effectiveness
- Business specific ratios and thresholds
Every organisation speaks one operational language — we help you define and standardise it.
While dashboards require time, interpretation, and alignment, our reports are designed to be read, discussed, and acted upon.
Why Tailored Reports Outperform Self-Service Dashboards
Dashboards are powerful—but only when teams have time, context, and alignment.
Leadership teams need something different
Dashboards
- Require interpretation
- Vary by user
- Often ignored
- Tool centric
Tailored Insights & Reports
- Ready-to-consume
- Consistent across leadership
- Used in reviews
- Outcome centric
Our report highlights
What changed
Explain why it matters
Indicate where to act
How It Works
From store activity to boardroom insights
4 Step flow
Step 1: Capture
In-store activity captured through edge devices
Step 2: Compute
Cloud-based processing and KPI computation
Step 3: Standardise
KPIs normalised across locations and formats
Step 4: Deliver
Tailored reports delivered to management teams
Designed To Scale With Your Business
Whether you operate 5 locations or 1000, our model scales effortlessly
- Add new locations by adding devices
- No local servers or complex IT setups
- Centralised cloud-based management
- Uniform KPIs across geographies
As your footprint grows, your insights remain consistent
Technology That Works Quietly In The Background
Our solution includes purpose-built edge devices and AI cameras designed to ensure:
The technology enables the insights—but the insights are the product.
Built For Operations. Trusted by Leadership
We work with teams that value